Once we have grasped how easy it is to open and save images with OpenCV, today we take the next step to see how to make simple annotations. Specifically we want to cover how to add lines, shapes, or even text to our image.
Basic Shapes and Text – Drawing Lines
Unquestionably one of the simplest edit we can do on any image is to draw a line on it. For this purpose we tell our program how to achieve this by passing important parameters. That is to say, we need to identify:
- Which image to draw on
- Where the start and end of the line is
- What color should the line be
- How thick the line should be

Before we can draw our line, we need to understand how to specify location on our image. The coordinate system for any image is represented by (x,y) coordinates. Most important to note is that the origin (0,0) is located on the upper left. Conversely the bottom right pixel is equivalent to the size of our image in pixels.
Furthermore, when specifying the color, remember OpenCV works with BGR (Blue, Green, Red color space). Hence any color should be described as a 3-Tuple ranging from 0 to 255.
First we import OpenCV, define some helper functions that will come in handy (optional), and load our image.
import cv2. #Importing the OpenCV Library
import numpy as np #Importing numpy as we may need this later on

#The line below is necesary to show Matplotlib's plots inside a Jupyter Notebook
%matplotlib inline
from matplotlib import pyplot as plt

#Use this helper function if you are working in Jupyter Lab
#If not, then directly use cv2.imshow(<window name>, <image>)

def showimage(myimage):
    if (myimage.ndim>2):  #This only applies to RGB or RGBA images (e.g. not to Black and White images)
        myimage2 = myimage[:,:,::-1] #OpenCV follows BGR order, while matplotlib likely follows RGB order

    fig, ax = plt.subplots(figsize=[10,10])
    ax.imshow(myimage2, cmap = 'gray', interpolation = 'bicubic')
    plt.xticks([]), plt.yticks([])  # to hide tick values on X and Y axis
    plt.show()

#Load our image
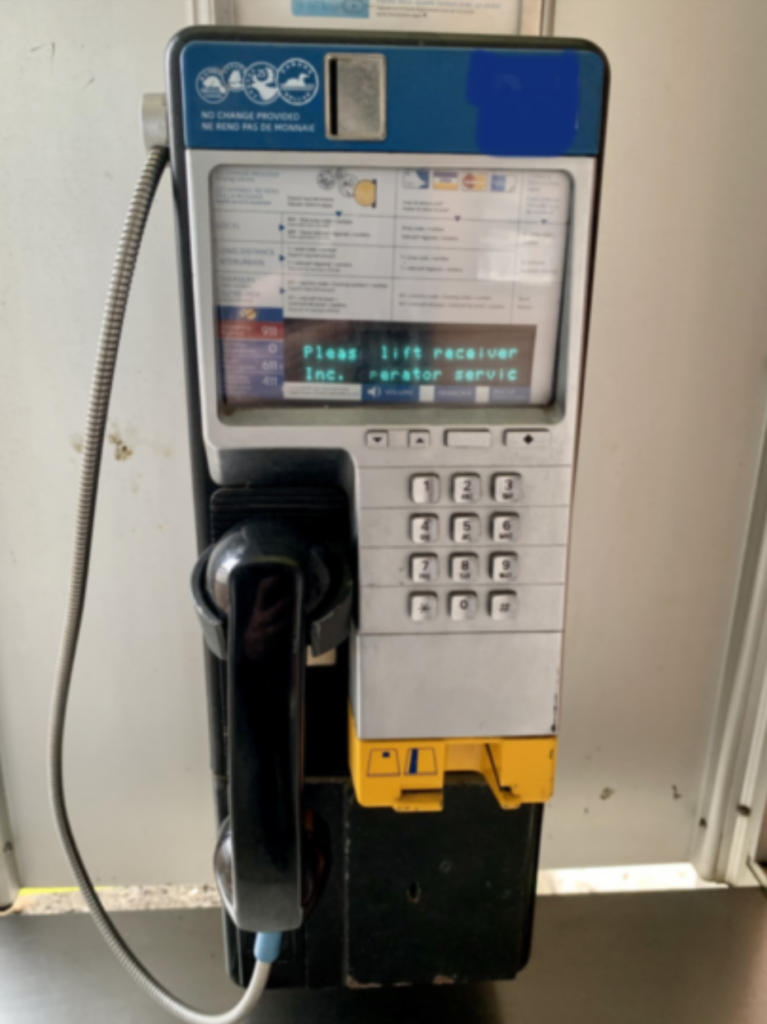
image = cv2.imread("Phone.jpg")
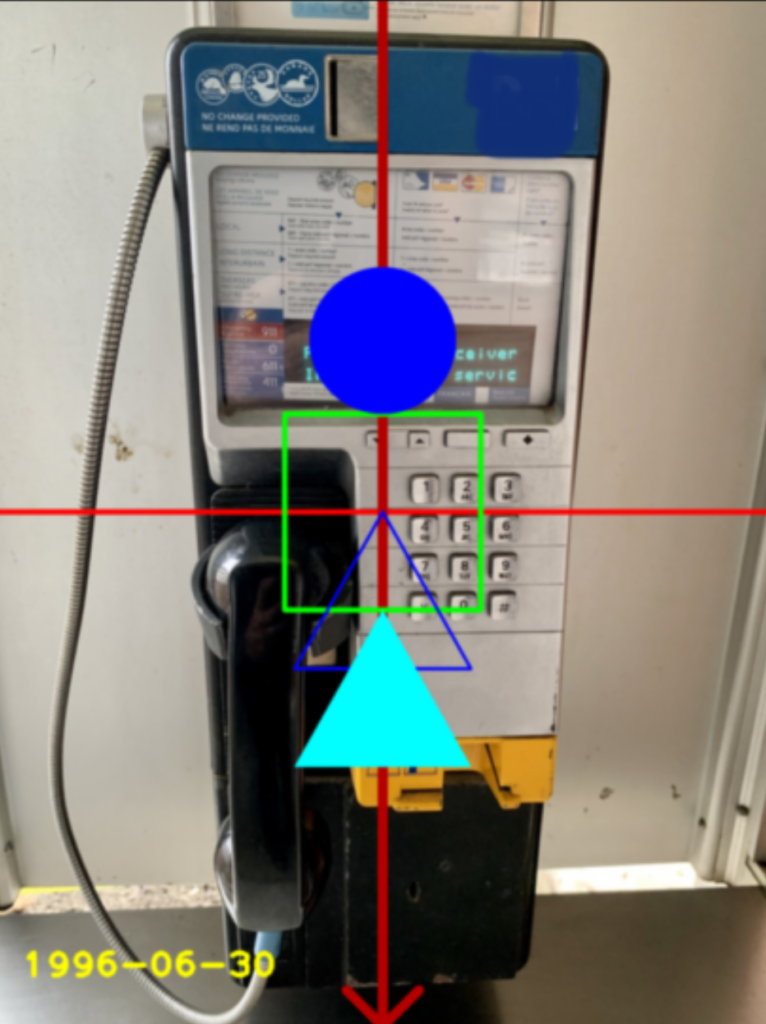
Finally, if we wanted to draw a red horizontal line through our image, we simple do the following:
#Drawing a horizontal line bisecting our image
startpoint = (0,int(image.shape[0]/2))  # (0, middle of image). We expect (0,1050)
endpoint = (image.shape[1],int(image.shape[0]/2)) # (width of image, middle of image). We expect (1575, 1050)
drawcolor = (0,0,255)  #BGR - Here we chose Red
thickness = 10

#Draw line
image = cv2.line(image,startpoint, endpoint,drawcolor,thickness)
Another useful annotation is the arrowed line. Because the needed information is the same, the only point to note is that the endpoint is where the arrow is pointing towards.
#Draw an Arrowed Line
startpoint = (int(image.shape[1]/2),0)
endpoint = (int(image.shape[1]/2),image.shape[0])
drawcolor = (0,0,180)
thickness = 20
tipLength=0.05

image = cv2.arrowedLine(image,startpoint, endpoint,drawcolor,thickness,tipLength=tipLength)
Basic Shapes and Text – Rectangles
In similar fashion, drawing a rectangle onto our image is not too different from drawing a line. Whereas before we provided coordinates of the start and end of the line, with OpenCVs rectangle function, we provide the upper left and lower right corners to draw our rectangle
upperleft = (int(image.shape[1]/2)-200, int(image.shape[0]/2)-200)  #Upper Left corner
lowerright = (int(image.shape[1]/2)+200, int(image.shape[0]/2)+200)  #Lower Right corner
drawcolor = (0,255,0)  #Green color
thickness = 10

image=cv2.rectangle(image, upperleft, lowerright, drawcolor, thickness)
Basic Shapes and Text – Circles
Equally as easy as drawing rectangles, by now you may have been able to guess how to draw circles. As has been noted before, we start by identifying which image to edit, provide the centre of our circle, it’s radius, color, and thickness. Once in a while, we may want to fill the color of our shape. In order to do that, we only need to provide a negative number to its’ thickness.
radius = 150
drawcolor = (255,0,0) # Blue
thickness = -1 #-1 for Filled shape
circlecenter = (int(image.shape[1]/2),int(image.shape[0]/2)-350)

image=cv2.circle(image, circlecenter, radius, drawcolor, thickness)
Polygons
Until now, we can draw most shapes with only a single one of code and providing the needed attributes. Conversely the drawing of polygons become slightly more complex as there could be several different points in our shape. At this point it would be best if we started with a list of coordinates that represent the points in our shape. Furthermore, based on the points, we need to decide whether we want a closed shape or not. As an illustration, please check the code snippet where we attempt to draw two triangles.
#Define the points of our Triangle
polygon = np.array([[int(image.shape[1]/2),int(image.shape[0]/2)],
                    [int(image.shape[1]/2)-180,int(image.shape[0]/2)+320],
                    [int(image.shape[1]/2)+180,int(image.shape[0]/2)+320]],
                   np.int32)

polygon = polygon.reshape((-1,1,2))
thickness=5

image = cv2.polylines(image, [polygon],True,drawcolor, thickness)
In order to draw a filled triangle, we need to adjust our code. Instead of using polylines, we need to use fillPoly.
#Define the points of our Filled Triangle
fillpolygon = np.array([[int(image.shape[1]/2),int(image.shape[0]/2)+200],
                        [int(image.shape[1]/2)-180,int(image.shape[0]/2)+520],
                        [int(image.shape[1]/2)+180,int(image.shape[0]/2)+520]],
                       np.int32)

fillpolygon = fillpolygon.reshape((-1,1,2))
thickness=5
drawcolor=(255,255,0)

image = cv2.fillPoly(image, [fillpolygon], drawcolor)
Inserting Text
Especially useful is the ability to add text and annotate our image. By and large this can be useful in many cases. If you’ve ever seen photos with dates recorded on the corner from old 35mm film cameras, then you will find this to be familiar. In similar fashion, we can add text to our image to achieve a similar effect. Important to note the location we specify is the lower left corner for our text annotation.
Text = "1996-06-30"
font = cv2.FONT_HERSHEY_PLAIN  #One of a handful of fonts available from OpenCV
fontscale = 5
Lowerleft = (50, int(image.shape[0]-100))
thickness=10
drawcolor=(0,255,255)

image=cv2.putText(image, Text, Lowerleft, font, fontscale, drawcolor, thickness)
Summary
Until now, we have added many shapes and text onto our image. At this point, we can quickly display our image with OpenCV to verify what we have achieved.


