Contours and Bounding Boxes
More often than not, the images we take consist of a complex composition. Particularly, it may contain one or more objects of interest. If we wanted to find the largest shapes in a picture, then we can use OpenCV’s contours and draw bounding boxes features. Essentially we will be looking for objects within our image and then drawing a box to highlight them. Before proceeding, we will build upon how to draw shapes on an image, as well as how to use image thresholding to support us. Make sure to check those articles to get familiar with some of the concepts before proceeding. Lastly, we would also highlight, this is not an article on object detection with machine learning. We will cover machine learning topics in later articles.
Setup libraries and read our image
As usual the first thing we do as preparation is to import OpenCV along with our helper functions. While our helper functions are optional, it does help some of us using Jupyter Lab with displaying inline images. Obviously you may use whatever you are most comfortable with.
import cv2
import numpy as np

#The line below is necessary to show Matplotlib's plots inside a Jupyter Notebook
%matplotlib inline

from matplotlib import pyplot as plt

#Use this helper function if you are working in Jupyter Lab
#If not, then directly use cv2.imshow(<window name>, <image>)

def showimage(myimage):
    if (myimage.ndim>2):  #This only applies to RGB or RGBA images (e.g. not to Black and White images)
        myimage = myimage[:,:,::-1] #OpenCV follows BGR order, while matplotlib likely follows RGB order

    fig, ax = plt.subplots(figsize=[10,10])
    ax.imshow(myimage, cmap = 'gray', interpolation = 'bicubic')
    plt.xticks([]), plt.yticks([])  # to hide tick values on X and Y axis
    plt.show()
Once we are satisfied, we can quickly display our image to ensure it was successfully loaded.
# Read in our image
reddress = cv2.imread("RedDress1.jpg")
showimage(reddress)

Generating a mask
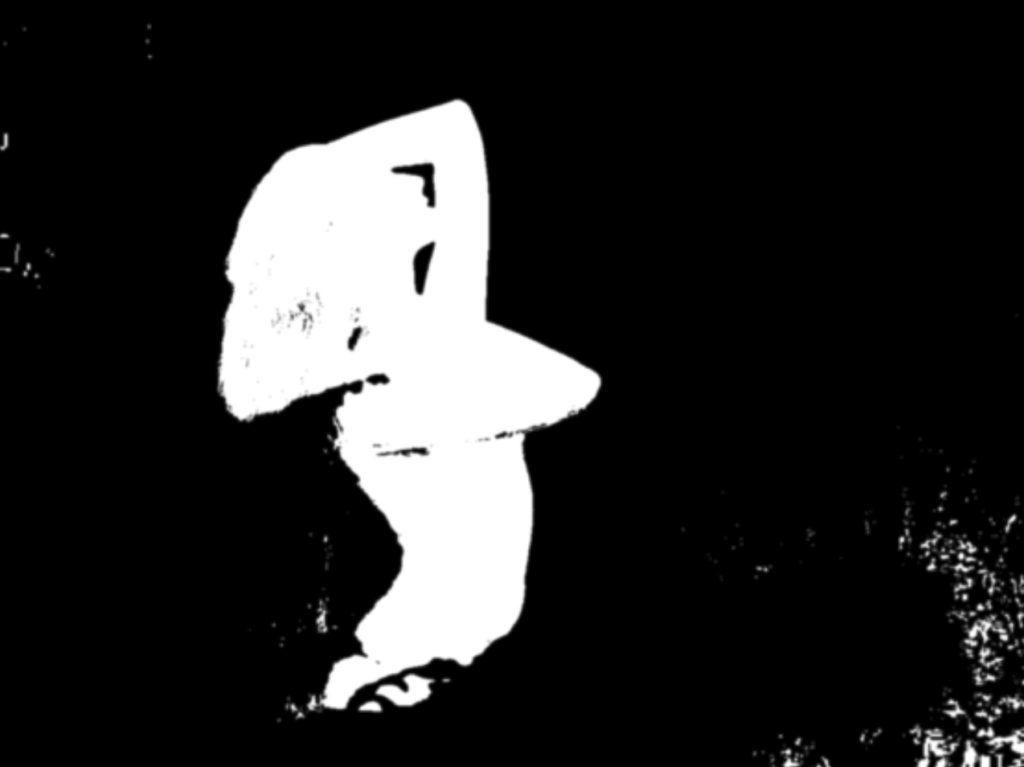
As we had seen before in our article on Image Thresholding, a complex image on its own is difficult to isolate elements of interest. Instead, by using image thresholding we can simplify our image based on a subject by color. In this case as our objective is to draw a bounding box around the lady in the picture, we first simplify our image similar to before. Consequently this means all the grass/green color is not in our interest. As a result, we produce a Mask; a black and white picture that identifies pixels that are of interest.
# Generate a mask

# Convert BGR to HSV
reddress_hsv = cv2.cvtColor(reddress, cv2.COLOR_BGR2HSV)

# Remember that in HSV space, Hue is color from 0..180. Red 320-360, and 0 - 30. Green is 30-100
# We keep Saturation and Value within a wide range but note not to go too low or we start getting black/gray
lower_green = np.array([30,140,0])
upper_green = np.array([100,255,255])

# Using inRange method, to create a mask
mask = cv2.inRange(reddress_hsv, lower_green, upper_green)

# We invert our mask only because we wanted to focus on the lady and not the background
mask[mask==0] = 10
mask[mask==255] = 0
mask[mask==10] = 255
showimage(mask)

As illustrated above, the silhouette of our subject is near the center and is the largest contiguous block of white pixels. Conversely when we look at the bottom right, we see many smaller white patches.
Identifying Contours
With our mask and previous observation, we are now ready to create contours. As the name suggests, a contour is the outline of a contiguous set of adjacent pixels. Primarily used for shape analysis, contours allow us to find its area, the extreme points, mean color, etc. However in this article, we will mainly focus on determining the area of our contours. In order to ignore the small contours on the bottom right of our image, the size will be used to isolate our subject.
First, we use OpenCVs built-in function to create the list of contours in our mask. Apart from telling OpenCV our mask, we provide two additional arguments to the function. Interested readers can further read the documentation what they are. The second argument in the function refers to the contour retrieval mode, and the third is the contour approximation method.
# Generate contours based on our mask
contours,hierarchy = cv2.findContours(mask, 1, 2)
Subsequently, we write a small function to loop through the contours and generate a descending sorted list of contour areas.
# This function allows us to create a descending sorted list of contour areas.
def contour_area(contours):

    # create an empty list
    cnt_area = []

    # loop through all the contours
    for i in range(0,len(contours),1):
        # for each contour, use OpenCV to calculate the area of the contour
        cnt_area.append(cv2.contourArea(contours[i]))

    # Sort our list of contour areas in descending order
    list.sort(cnt_area, reverse=True)
    return cnt_area
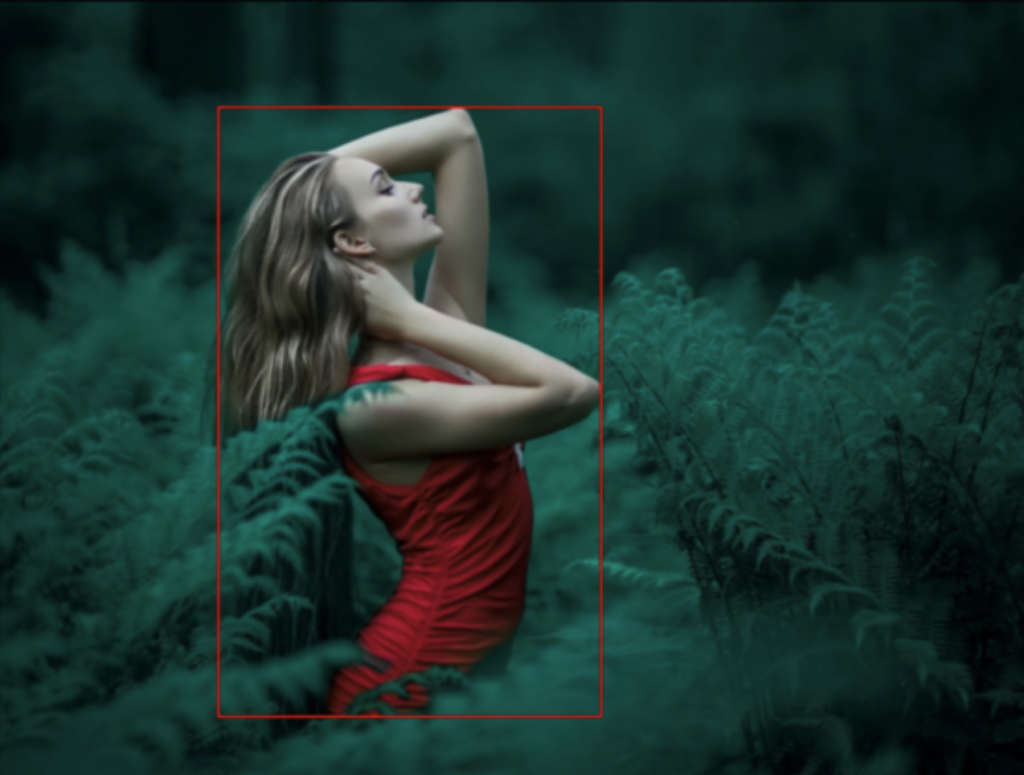
At the present time, we only want to draw a bounding box around the largest shape. With this in mind, only contours with area equal or greater than our first nth element (here n=1), will be drawn. Conversely, had we wanted to draw a bounding box around the top 3 largest objects, with our sorted list, we could achieve this also.
Drawing Bounding Boxes
We saw before how to annotate images by adding text or drawing shapes. Therefore we can write a small function that will essentially:
- Call our function above to create a descending sorted list of contour area
- Loop through each of our contour and determine if its area is greater or equal to the nth largest contour(s)
- Draw a Red Rectangle around the nth largest contour(s)
def draw_bounding_box(contours, image, number_of_boxes=1):
    # Call our function to get the list of contour areas
    cnt_area = contour_area(contours)

    # Loop through each contour of our image
    for i in range(0,len(contours),1):
        cnt = contours[i]

        # Only draw the the largest number of boxes
        if (cv2.contourArea(cnt) > cnt_area[number_of_boxes]):

            # Use OpenCV boundingRect function to get the details of the contour
            x,y,w,h = cv2.boundingRect(cnt)

            # Draw the bounding box
            image=cv2.rectangle(image,(x,y),(x+w,y+h),(0,0,255),2)

    return image
Finally, based on the above, we only need to call our function to see our results.
reddress = draw_bounding_box(contours, reddress)
showimage(reddress)

Interested readers can next further follow-up and see why understanding Contour Hierarchy will make our approach more robust. Finally these techniques will further help us with image segmentation.


